
Article
MTTR, MTBF and downtime cost: the formulas, with a worked example in INR and USD
MTTR and MTBF are one division each. The hard part is what goes in them. The IEC 60050-192 definitions, why waits for parts and permits belong inside MTTR, operating vs calendar hours for MTBF, availability, and a downtime cost worked example in INR and USD.
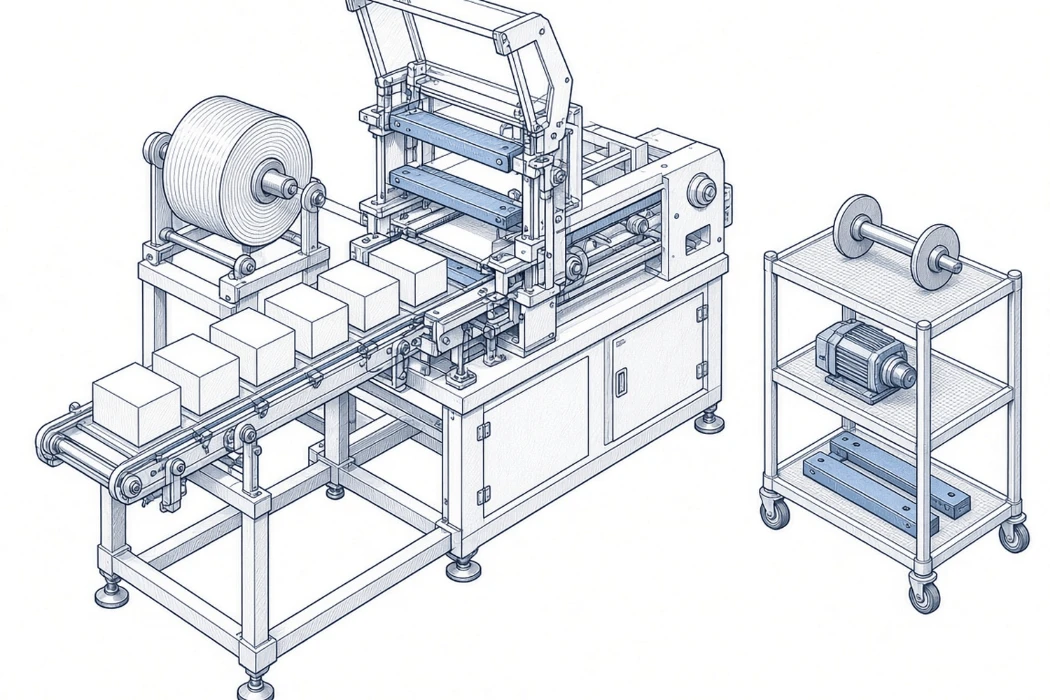
Here is a situation we'll use as an illustration. It is invented, not a reported case. A packaging line has four breakdowns in a month. The day shift logs each one from the moment the line stopped to the moment it was running again. The night shift logs only the time someone was actually working on the machine, and leaves out the wait for the store to open and the permit to be signed. At month end, both numbers go into the same column and get averaged. The MTTR that comes out belongs to neither shift, and next month's figure can't be compared with this one.
The arithmetic is not the hard part. MTTR and MTBF are one division each. The hard part is agreeing what goes on top of the line and what goes underneath, and writing it down so every shift records the same thing.
Short answer: MTTR = total time to restoration / number of failures. MTBF = total operating time / number of failures. Use operating time, not calendar time, and count waiting for parts and permits inside MTTR. Downtime cost per event = hours down x (lost contribution + idle labour per hour) + repair labour + parts.
Applies to: maintenance teams calculating MTTR, MTBF and downtime cost for one machine or line from a breakdown register (India) or repair log (US). Every input in the worked example is an example number, not data from a real plant. Last verified: 12 Nov 2026. Author: Muhammed Fahiz
What do MTTR and MTBF actually mean?
MTTR is the mean time to restoration and MTBF is the mean operating time between failures. Those are the names used in IEC 60050-192, the International Electrotechnical Vocabulary part on dependability. The wording in this post comes from the text of that standard as reproduced, entry by entry, on the nlfnorm.cz terminology database (links in Sources):
| Term | IEC 60050-192 entry | Definition (quoted) |
|---|---|---|
| Time to restoration | 192-07-06 | "time interval, from the instant of failure, until restoration" |
| MTTR, mean time to restoration | 192-07-23 | "expectation of the time to restoration" |
| Repair time | 192-07-19 | "part of active corrective maintenance time taken to complete repair action" |
| MRT, mean repair time | 192-07-21 | "expectation of the repair time" |
| Operating time between failures | 192-05-04 | "operating time accumulated between consecutive failures" |
| MTBF, mean operating time between failures | 192-05-13 | "expectation of the duration of the operating time between failures" |
Three notes in the standard matter on the shop floor:
- "Mean time to repair" is marked deprecated as a name for MTTR (192-07-23). The current term is time to restoration, which runs from the failure until the item is restored, not just while a spanner is turning.
- Repair time excludes delays. The note to 192-07-19 says repair time covers fault localization, fault correction and function checkout, "but excludes technical, administrative and logistic delays." So hands-on repair time is a different measure, MRT, not MTTR.
- MTBF is for repairable items only (note to 192-05-13). For parts you throw away, the measure is MTTF, mean operating time to failure.
In our invented example, the day shift was logging time to restoration. The night shift was logging something close to repair time. Both are legitimate measures. They just aren't the same measure, and they can't share a column.
How do you calculate MTTR?
Add up the time to restoration for every failure in the period, then divide by the number of failures. On a breakdown register, time to restoration is "stopped at" to "back in service" for each breakdown. If nobody knows exactly when it failed, the standard's note to 192-07-06 says the interval starts when the failure was detected.
MTTR = sum of (back in service - stopped) / number of failures
The standard also names the waits that sit inside that interval. An administrative delay is a "delay to maintenance action incurred for administrative reasons", for example "Time accumulated awaiting authorization to access the item to be maintained" (192-07-12). A logistic delay covers "travelling to installations, and waiting for spare parts, specialists, test equipment, information or suitable environmental conditions" (192-07-13).
Here is the worked example. All numbers are example numbers, chosen to make the arithmetic easy to follow:
| Breakdown (example) | Time to restoration (h) | Of which: admin wait, e.g. permit (h) | Of which: logistic wait, e.g. spare part (h) | Of which: repair time (h) |
|---|---|---|---|---|
| 1. Infeed conveyor motor trip | 3.0 | 0.25 | 0.75 | 2.0 |
| 2. Sealing jaw heater fault | 1.5 | 0.25 | 0 | 1.25 |
| 3. Gearbox bearing failure | 5.5 | 0.5 | 3.0 | 2.0 |
| 4. Film splice sensor fault | 2.0 | 0.25 | 0.5 | 1.25 |
| Total | 12.0 | 1.25 | 4.25 | 6.5 |
- MTTR = 12.0 h / 4 failures = 3.0 h
- Mean repair time (MRT) = 6.5 h / 4 = 1.625 h, about 1.6 h
The same four breakdowns give 3.0 h or 1.6 h depending on what was logged. Mix the two and you get a number in between that describes nothing. The fix is a written rule for the register, for example: "Downtime = stopped to back in service. Note permit wait and parts wait in their own columns." Then MTTR and MRT can both be calculated from one record.
How do you calculate MTBF?
Divide the total operating time in the period by the number of failures. The NIST/SEMATECH e-Handbook of Statistical Methods puts it as: "The best estimate of the MTBF is just 'Total Time' divided by 'Total Failures'", with the time being total system operation time. NIST gives this estimate under its constant repair rate (HPP / exponential) model, so treat it as a working average, not a prediction of when the next failure will come.
MTBF = total operating time / number of failures
The word that causes trouble is operating. Here is the same machine and month counted three ways (example numbers: a 30-day month, 26 working days, two 8-hour shifts):
| Time base (example) | Hours | / 4 failures | Is it MTBF? |
|---|---|---|---|
| Calendar time: 30 days x 24 h | 720 | 180 h | No. Counts nights, Sundays and holidays when the line wasn't running |
| Planned production time: 26 days x 16 h | 416 | 104 h | No. Still includes the 12 h the line was down |
| Operating time: 416 - 12.0 h downtime | 404 | 101 h | Yes. Time the line was actually running |
If one site reports 180 h and another 101 h, they may have the same machine behaving the same way. Write the time base into the register header, next to the downtime rule.
How do MTTR and MTBF give you availability?
Divide MTBF by MTBF plus MTTR. IEC 60050-192 entry 192-08-07 says that under certain conditions steady state availability "may be expressed as the quotient of the mean up time to the sum of the mean up time, to mean down time", and points to IEC 61703 for the maths. On a register where failures are the only downtime, MTBF and MTTR are the usual stand-ins for mean up time and mean down time.
Availability = MTBF / (MTBF + MTTR)
Worked example: 101 / (101 + 3.0) = 101 / 104 = 0.971, or 97.1%. As a cross-check, 404 operating hours / 416 planned hours gives the same 97.1%. If planned stops, changeovers or cleaning also take the line down, they need their own column, or this simple formula will overstate availability.
How do you estimate the cost of downtime per hour?
Add up what one hour stopped costs you, multiply by the hours down, then add what the repair itself cost. This is the method we use. It's not taken from a standard:
Cost of downtime = hours down x (lost contribution per hour + idle labour per hour) + repair labour + parts and outside service
- Lost contribution per hour = units you would have made in that hour x (selling price - variable cost per unit). Use contribution, not sales value: the material you didn't use isn't a loss.
- Idle labour per hour = the crew you pay while the line is stopped.
- Repair labour = technician hours x rate. Count your own team and any outside service engineer.
- Parts = what was fitted, at cost.
The worked example below uses the same 12.0 hours down. All inputs are example numbers. The USD column is a separate example with its own inputs, not a currency conversion of the INR column.
| Input or result (example) | INR example | USD example |
|---|---|---|
| Output per hour | 400 packs | 400 packs |
| Contribution per pack | INR 30 | USD 0.90 |
| Lost contribution per hour | INR 12,000 | USD 360 |
| Idle crew per hour (3 operators) | 3 x INR 250 = INR 750 | 3 x USD 22 = USD 66 |
| Hours down in the month | 12.0 | 12.0 |
| Lost contribution (12.0 h) | INR 144,000 | USD 4,320 |
| Idle crew (12.0 h) | INR 9,000 | USD 792 |
| Repair labour (6.5 h x 2 technicians) | 13 h x INR 400 = INR 5,200 | 13 h x USD 45 = USD 585 |
| Parts (bearing, seal, sensor) | INR 18,000 | USD 600 |
| Total for the month | INR 176,200 | USD 6,297 |
| Per hour of downtime (total / 12.0 h) | about INR 14,683 | about USD 525 |
In both columns, lost contribution is by far the biggest line, and it is set by the output and margin you entered, not by anything the maintenance team did. That's why we don't quote an industry "cost per hour" here. A figure from somebody else's plant tells you nothing about your line's output and contribution.
Two adjustments that change the answer:
- If the lost output is made up later with overtime, use the overtime cost instead of lost contribution for those hours.
- If the line is the bottleneck, an hour lost on it is an hour lost for the whole plant. If it isn't, part of the lost output may be absorbed by buffer stock.
What happens to the numbers if you cut the waiting time?
The worked example shows where to look. Of the 12.0 hours down, 4.25 were logistic waits and 1.25 were administrative waits. That's 5.5 hours, nearly half, with nobody repairing anything.
Take breakdown 3 and suppose the bearing had been on the shelf, so the 3.0 h parts wait disappears (still example numbers):
| Measure | As logged | Bearing in stock | Change |
|---|---|---|---|
| Total time to restoration | 12.0 h | 9.0 h | -3.0 h |
| MTTR (/ 4) | 3.0 h | 2.25 h | -0.75 h |
| Operating time | 404 h | 407 h | +3 h |
| MTBF (/ 4) | 101 h | 101.75 h | +0.75 h |
| Availability | 97.1% | 97.8% | +0.7 points |
| Lost contribution + idle crew, INR example | INR 153,000 | INR 114,750 | -INR 38,250 |
The repair work didn't change. The cost fell because of the wait. That only shows up if the register records the wait as its own item. A register that logs a single "downtime" figure per breakdown can't tell you whether to spend on spares, on faster permits or on training.
Can you compare your MTTR with published figures?
Only if you know how the published figure was measured. A 2025 conference paper by Van Gaitano N. Vergara (Cebu Technological University) assessed preventive maintenance in micro, small and medium machine shops in Cebu City, Philippines. Its abstract reports MTBF and MTTR for the machines it found most problematic:
| Machine (Cebu City MSMIs, per the abstract) | MTBF | MTTR |
|---|---|---|
| Lathe | 486 h | 144 h |
| Welding | 541 h | 59 h |
| Portable grinder | 311.63 h | 13.5 h |
The abstract also reports "inadequate documentation" among its results. It doesn't say whether MTTR there is time to restoration or hands-on repair time, or whether MTBF uses operating or calendar hours, and the full paper is not open access, so we haven't read the method. If you plug the lathe figures into the availability formula you get 486 / (486 + 144) = 77%. That is our arithmetic, not a result the paper reports, and it only means something if the paper's MTTR is time to restoration. A 144-hour MTTR on a lathe reads more like waiting for a part or a technician than six days of hands-on work. That's a guess, and it's exactly the question the definition settles.
The paper is from the Philippines, not India or the US. Use it as an example of how these metrics get reported, not as a benchmark for your plant.
What do you need in the register to calculate all this?
Six columns per breakdown, plus two lines in the header. Most of these are already in the breakdown register format and the US equipment repair log template:
| Column | Why the calculation needs it |
|---|---|
| Asset ID | MTBF and MTTR are per machine. Without one ID per machine, the failures can't be grouped |
| Stopped at (date, time) | Start of time to restoration |
| Back in service (date, time) | End of time to restoration. "Running" means running, not "parts ordered" |
| Admin wait (h) | Permits, approvals, access. Shows up in MTTR, not in repair time |
| Parts / logistics wait (h) | Spares, travel, specialists. The column that tells you whether to stock the part |
| Repair hours and technicians | Mean repair time and repair labour cost |
| Header: time base | "Operating time = planned production time minus downtime", or whatever your site uses, written once |
| Header: downtime rule | "Stopped to back in service, waits included" |
To use this as a calculator, paste the example rows into a spreadsheet and add these formulas. The cell layout is an example: B2 = planned production hours, B3 = number of failures, B4 = total time to restoration, B5 = total repair hours.
| Result | Spreadsheet formula |
|---|---|
| MTTR | =B4/B3 |
| Mean repair time | =B5/B3 |
| Operating time | =B2-B4 |
| MTBF | =(B2-B4)/B3 |
| Availability | =((B2-B4)/B3)/(((B2-B4)/B3)+(B4/B3)) |
Count a failure once, even if the same fault comes back within the hour. Decide whether a repeat inside the same shift is one breakdown or two, and write that down too. If the same machine keeps showing up under different descriptions, the failure count itself will be wrong. See why repeat faults never add up. And a breakdown closed as "running now" with no cause recorded will count as a failure but teach you nothing. More on that in "It's running now" is not a fix.
What this doesn't tell you
The worked example is invented and so are all its inputs. The cost method is ours, not a standard. MTBF here is a plain average under NIST's constant-rate assumption. It won't predict wear-out failures or the next breakdown on a given day. We don't give an industry downtime cost per hour, because the inputs that drive it (output and contribution) are specific to your line. Live SERP and search volume for this query were not checked.
Where does HangerSearch fit?
MTTR goes down when the fix is found faster, and the fix is often in a report someone already wrote. If the answer to "what did we do last time?" is usually a person, see "Who fixed it last time?" If the answer is a name, not a record.
HangerSearch is private search over your team's own finalized service reports, searched where they already sit. You search by fault code, model or symptom, and it shows the earlier reports that match and opens the cited page. It doesn't calculate MTTR or MTBF. It helps with the part of the repair spent working out what was done last time. See how we handle your reports.
Book a 20-minute demo: hangersearch.com
FAQ
What is the formula for MTTR?
MTTR = total time to restoration / number of failures. Time to restoration runs from the failure (or its detection, if the failure time is unknown) until the machine is back in service. It includes waits for permits and spare parts. Hands-on repair time alone is a different measure, mean repair time.
What is the formula for MTBF?
MTBF = total operating time / number of failures. Use the hours the machine was actually running, not calendar hours or planned hours that still include downtime. NIST's statistics handbook gives this "total time divided by total failures" estimate under a constant repair rate model.
Is MTTR "mean time to repair" or "mean time to restoration"?
IEC 60050-192 uses mean time to restoration and marks "mean time to repair" and "mean time to recovery" as deprecated terms for MTTR. Restoration covers the whole interval until the item works again. Repair time is a narrower measure that excludes administrative, logistic and technical delays.
How do you calculate availability from MTBF and MTTR?
Availability = MTBF / (MTBF + MTTR). With the example figures in this post, 101 / (101 + 3.0) = 97.1%. This simple form only holds when breakdowns are the only downtime counted. Planned stops and changeovers need their own column.
How do you calculate the cost of one hour of downtime?
Add the lost contribution per hour (units per hour x margin per unit) to the cost of the idle crew per hour, then add repair labour and parts for the event. Use your own line's output and margin. A cost-per-hour figure from another plant won't match your line.
Sources
- IEC 60050-192:2015, International Electrotechnical Vocabulary, Part 192: Dependability, entries 192-05-04, 192-05-13, 192-07-06, 192-07-12, 192-07-13, 192-07-19, 192-07-21, 192-07-23, 192-08-07, as reproduced (Czech edition CSN IEC 60050-192, English and Czech text) on the nlfnorm.cz terminology database run by Institut pro testovani a certifikaci, Zlin: https://www.nlfnorm.cz/terminologicky-slovnik/90355 (MTTR), https://www.nlfnorm.cz/terminologicky-slovnik/90305 (MTBF), https://www.nlfnorm.cz/terminologicky-slovnik/90339 (time to restoration), https://www.nlfnorm.cz/terminologicky-slovnik/90352 (repair time), https://www.nlfnorm.cz/terminologicky-slovnik/90353 (mean repair time), https://www.nlfnorm.cz/terminologicky-slovnik/90302 (operating time between failures), https://www.nlfnorm.cz/terminologicky-slovnik/90345 (administrative delay), https://www.nlfnorm.cz/terminologicky-slovnik/90346 (logistic delay), https://www.nlfnorm.cz/terminologicky-slovnik/114194 (steady state availability). Opened 12 Nov 2026. The IEC's own Electropedia (electropedia.org) carries the same entries but blocked automated access on that date. Supports: all definitions, the deprecated-term note, the repair-time exclusions and the availability note.
- NIST/SEMATECH e-Handbook of Statistical Methods, section 8.4.5.1, "Constant repair rate (HPP/exponential) model": https://www.itl.nist.gov/div898/handbook/apr/section4/apr451.htm. Opened 12 Nov 2026. Supports: MTBF estimate = total operation time / total failures, under the constant repair rate model.
- Van Gaitano N. Vergara (Cebu Technological University), "Assessing Preventive Maintenance Program for Micro, Small, and Medium Scale Machine Shop Industries Using DEMATEL", 2025 4th International Conference on Computational Modelling, Simulation and Optimization (ICCMSO), pp. 190-197, published 20 Jun 2025. DOI: https://doi.org/10.1109/iccmso67468.2025.00041. Abstract only (full paper not open access); abstract read via the Semantic Scholar record and metadata via Crossref, 12 Nov 2026. Supports: the Cebu City MSMI MTBF/MTTR figures and "inadequate documentation". The 77% availability figure is our arithmetic, not the paper's.
Related
- Breakdown register format (Excel) that you can still search in two years
- Equipment repair log template that stays searchable
- Same machine, five descriptions: why repeat faults never add up
- "It's running now" is not a fix: leave a trail the next tech can find
- "Who fixed it last time?" If the answer is a name, not a record
- How HangerSearch handles your data